
Tool Steel Hardenability Chart
The section shows how deep each tool steel will harden, the hardness it reaches at the core, and the corresponding hardening temperature. Water-hardening grades harden a thin skin, oil-hardening grades go deeper, and air-hardening grades such as D2, A2, and S7 harden through the largest blocks, which determines whether a given grade can make a thick die section at all.
Section size each grade will harden through
Quench medium and the diameter the grade hardens through at that quench, with the hardness reached straight out of the quench. Hardening and tempering temperatures for the same grades are in the hardening and tempering chart.
| Grade | Hardens through | Quench | As-quenched HRC (a) |
|---|---|---|---|
| W2 | Chill depth 1/8–3/16 in. (3.2–4.8 mm) | Water | 68 HRC |
| O1 | Through 1-3/4 in. (44.5 mm) diameter | Oil | 64 to 65 |
| S5 | Through 3 in. (76.2 mm) diameter | Oil | 62–63 |
| A2 | Through 4-1/2 in. (114.3 mm) diameter | Air | 62–63 |
| S7 | Through 2-1/2 in. (63.5 mm) diameter | Air | 59–60 |
| D2 | Through 5 in. (127 mm) diameter | Air | 61–63 |
| M2 | Through 1-1/2 in. (38.1 mm) diameter | Air | 65–66 |
| H13 | Through 2-1/2 in. (63.5 mm) diameter | Air | 52–54 |
Source: Tool and Die Making Troubleshooter (R. M. Leed), Table 5-6, from Bethlehem Steel grade data sheets.
Hardening practice for die steels, round section
The section the grade fully hardens through, the hardness it is normally put to work at and the austenitizing temperature that produces it. Wear and toughness ratings for the same grades are in the general properties chart.
| Grade | Hardens through | Working HRC | Hardening temperature | Quench |
|---|---|---|---|---|
| W2 | Chill depth approximately 1/8 in. (3.2 mm) per side | 60–62 | 1,400–1,450 °F (760–788 °C) | Water quench |
| S7 | Through 2-1/2 in. (63.5 mm) round | 56–58 | 1,725 °F (941 °C) | Air quench |
| A2 | Through 4-1/2 in. (114.3 mm) round | 58–60 | 1,775 °F (968 °C) | Air quench |
| D2 | Through 5 in. (127 mm) round | 58–60 | 1,850 °F (1,010 °C) | Air quench |
Source: Tool and Die Making Troubleshooter (R. M. Leed), Table 5-8, quoting Bethlehem Steel data sheets for W2, S7, A2 and D2.
Hardening practice for mold steels, square section
Mold steels are quoted as square sections rather than round, because that is the shape of a mold block. A2 and S7 appear in both tables for that reason.
| Grade | Hardens through | Working HRC | Hardening temperature | Quench |
|---|---|---|---|---|
| A2 | Through 4-1/2 in. (114.3 mm) square | 58–60 | 1,775 °F (968 °C) | Air quench |
| S7 | Through 2-1/2 in. (63.5 mm) square | 56–58 | 1,725 °F (941 °C) | Air quench |
| 420 SS | Through 1-1/2 in. (38.1 mm) square | 48–50 | 1,750–1,850 °F (954–1,010 °C) | Air quench |
| H13 | Through 1-1/2 in. (38.1 mm) square | 46–48 | 1,850 °F (1,010 °C) | Air quench |
| P-20 | Prehardened, no hardening step | 28–32 | Prehardened on delivery | None |
Source: Tool and Die Making Troubleshooter (R. M. Leed), Table 5-10, from Bethlehem Steel data sheets.
How hard the other tooling materials are
Hardness of the coatings and non-steel materials that share a die with tool steel, in Knoop microhardness and the Rockwell C value usually quoted for them. Surface treatments that produce these layers are described on the surface treatment page.
| Material or coating | Knoop (HK) | Rockwell C (HRC) (b) |
|---|---|---|
| Diamond | 9,000 | 99 |
| Cubic boron nitride | 5,000 | 94 |
| Titanium nitride | 2,800 | 87 |
| Vanadium carbide | 2,500 | 85 |
| Silicon carbide | 2,400 | 84 |
| Aluminum oxide | 2,100 | 83 |
| Tungsten carbide | 1,900 | 82 |
| Zirconium oxide | 1,500 | 77 |
| Gas nitrided case | 850–1,000 | 65–70 |
| Chrome plating | 900–1,000 | 68–70 |
| Hardened high speed steels | 800–850 | 63–65 |
| Hardened tool steels | 460–690 | 45–60 |
| Annealed steels | 185 | 20 |
Source: Tool and Die Making Troubleshooter (R. M. Leed), Table 5-11, from Bry Coat hardness conversion estimates.
- Knoop and Rockwell C are not on the same scale. The values above 68 HRC are approximations, not conversions from hardness data, because the relationship between the two scales loses accuracy as Knoop values climb.
- The diameters above describe a round section cooled on all sides. Actual depth varies with part design, part mass, hardening temperature, and quench speed, and the core of a heavy rectangular block cools more slowly than the same weight of round bar.
Reading the table
Steels with good hardenability harden deeper and more safely. A grade that transforms at a slow cooling rate can be quenched in air, and an air quench puts far less stress into the part than water or oil, so the section is less likely to crack or to move out of shape. That is why the air-hardening grades carry the heaviest die sections, and why quench cracking is usually a story about a low-hardenability grade in a heavy section.
The quench medium matters as much as the grade. O1 hardens through 1-3/4 in. only when the oil is agitated and kept cool, and a part quenched too slowly will read low in the core while reading full hardness at the corner. Where a part must be quenched in water to harden, the section is limited by the risk of cracking rather than by the hardness target.
Air hardening also means less movement. D2 grows by plus or minus 0.0005 in. per in. of dimension through the whole cycle, versus 0.0015 in. per in. for an oil-hardening grade, the difference between grinding to size after hardening and hoping the block comes out close. The figures for every family are in the size change chart, and the stock to remove from as-supplied hot-rolled bar is in the machining allowance chart.
High hardenability is not the same as high working hardness. H13 hardens through 2-1/2 in. yet works at 46 to 48 HRC, because a hot work die trades hardness for toughness at temperature. The hot hardness these grades hold is shown in the hot hardness chart.
A shallow-hardening grade is the right answer for some tools. W2 gives a hard skin over a tough core in one quench, which suits a punch that needs a wear face and a body that will not shatter. P20 arrives prehardened at 28 to 32 HRC and is never hardened by the toolmaker, which is why the large mold blocks are made from it. Both routes are covered in the selection by application pages.
Unless you check the core, a low surface reading says nothing about hardenability. Decarburization and a slow quench both soften the skin of a part that hardened correctly inside. Cut or grind a few thousandths off before testing, and use the hardness-testing methods when a file isn’t enough. Values read on other scales convert in the hardness conversion calculator.
Hardenability comes from carbon and from the alloying elements that hold it in solution: chromium, molybdenum, manganese, and tungsten. Each grade’s composition is in the composition chart.
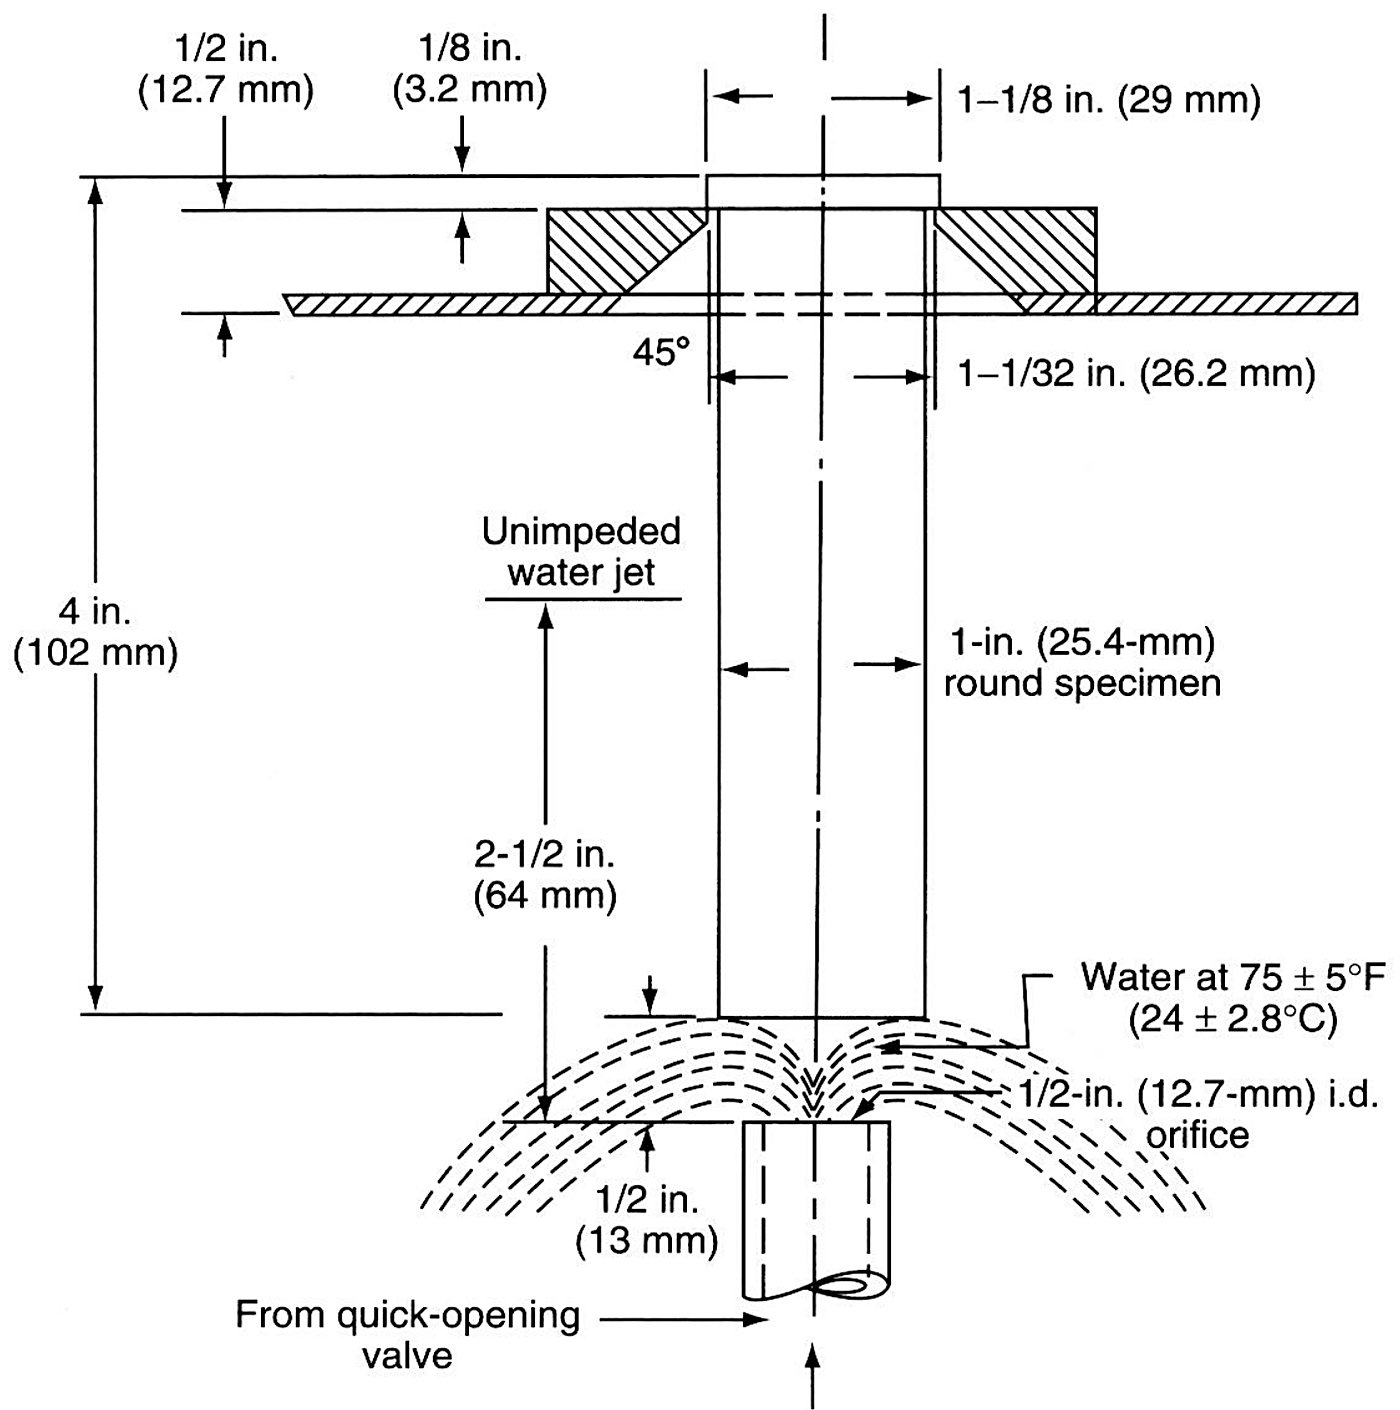
The numbers in the table come from the end-quench test, which measures hardenability. A 25 mm round bar is austenitized, fixed in its fixture, and quenched from one end only, so a single specimen covers a full range of cooling rates along its length.
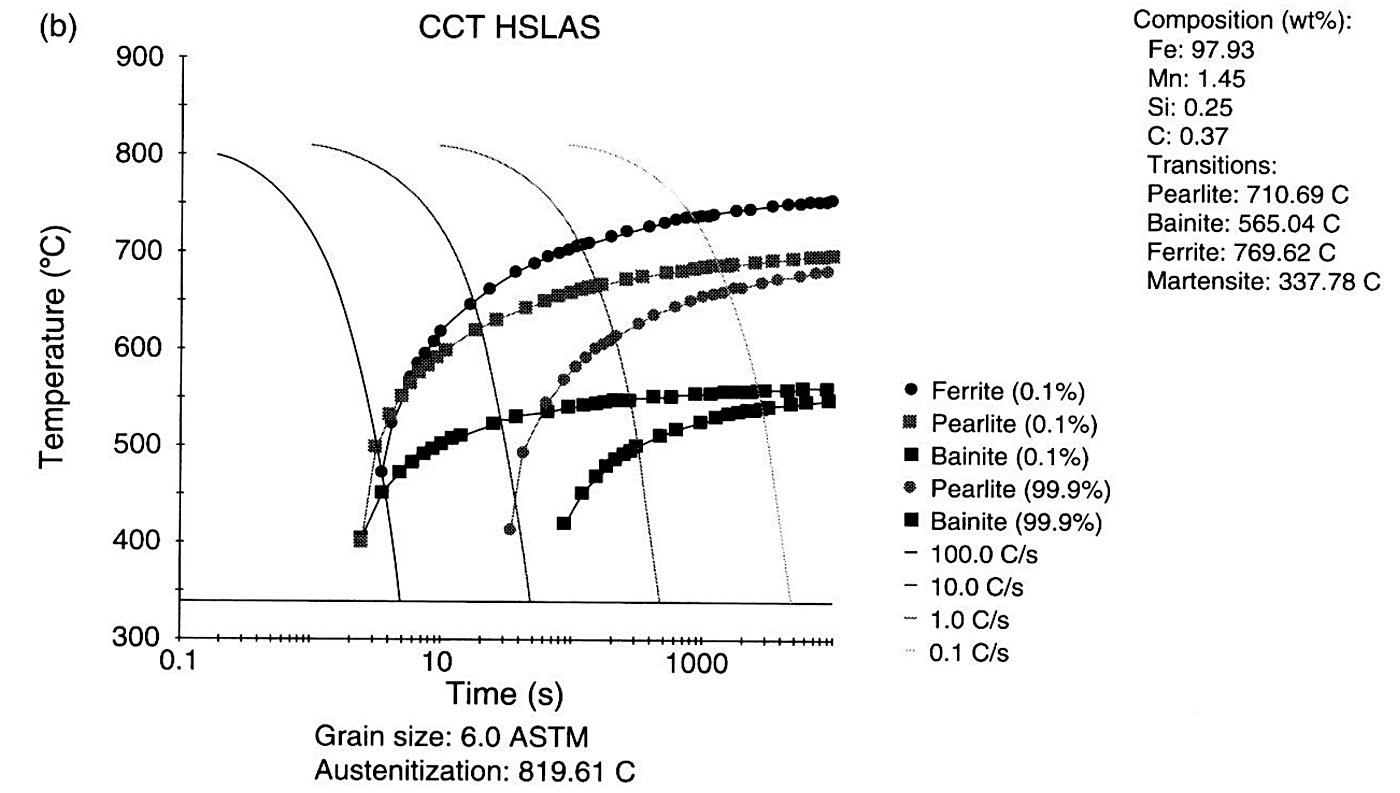
The tables above give the numbers. The diagram below shows why they come out the way they do: a calculated continuous cooling transformation diagram, with the cooling rates a real quench produces drawn across it. A fast curve misses the ferrite and pearlite start lines and lands in martensite; a slow one crosses them first and finishes as ferrite and pearlite, which is where the soft patches and the hardness below the drawing come from.
Match the quench to the section
Water quench for a thin section in a shallow-hardening grade, oil for the middle range, air for anything heavy or awkward. A quench faster than the section needs buys nothing and costs stress. Aobo Steel lists the round bar and plate sizes they carry in the tool steel catalog.
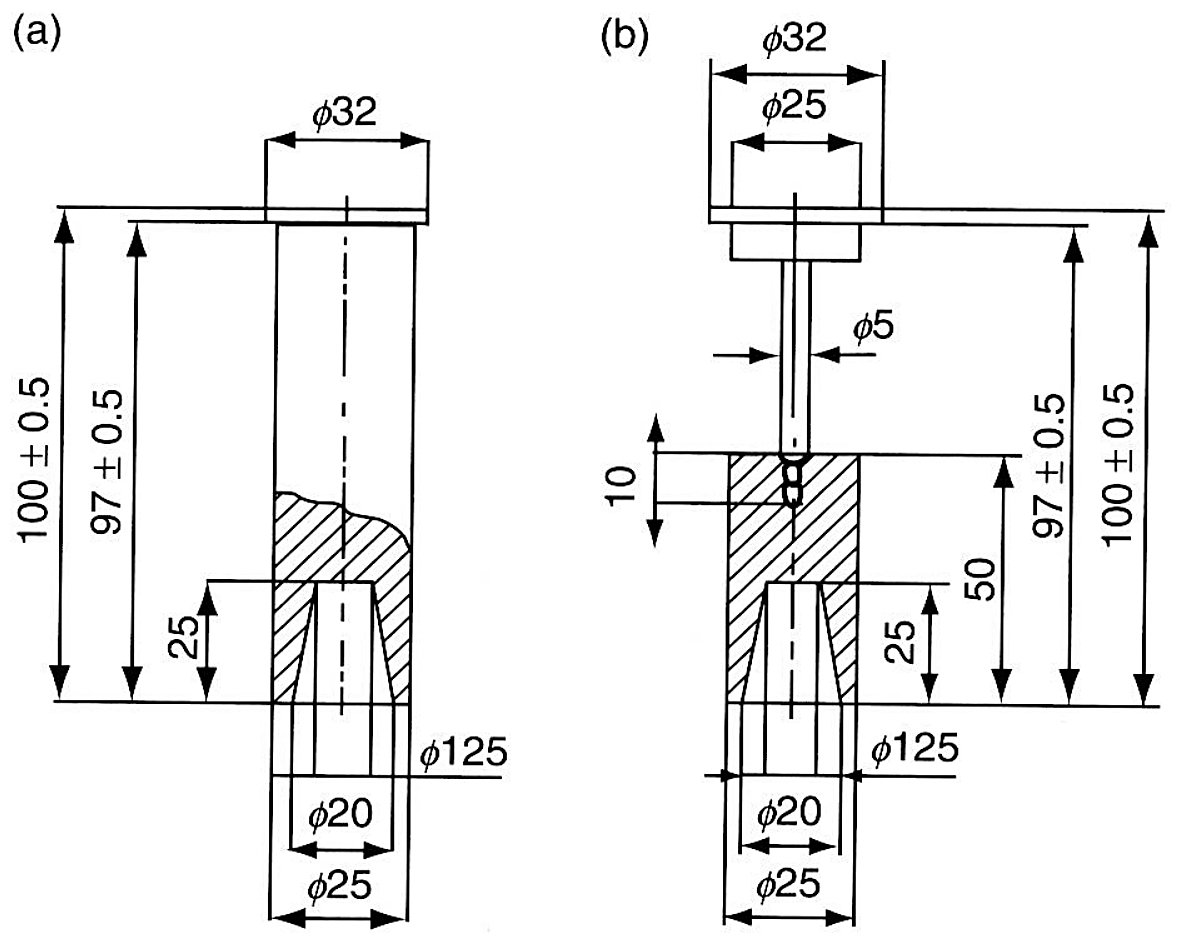
Shallow-hardening grades are the awkward case for that test because their hardenability is spent in the first few millimeters of the bar. Two special L specimens are used for them instead.
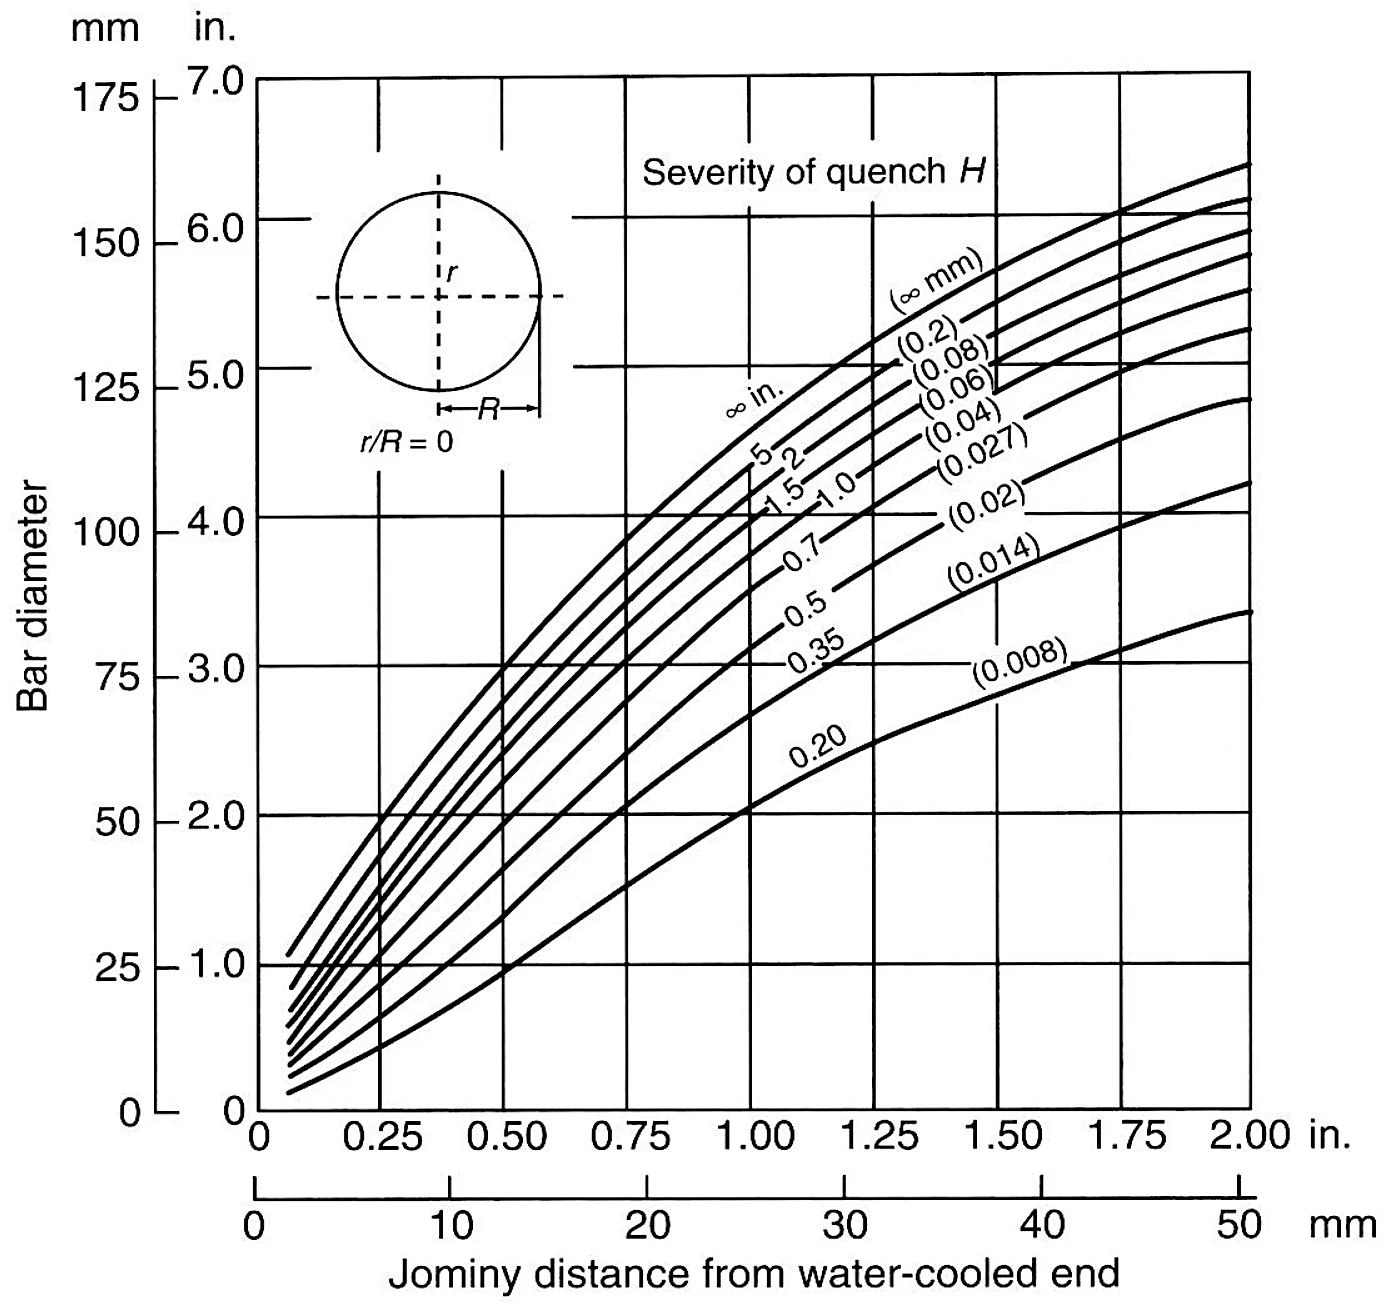
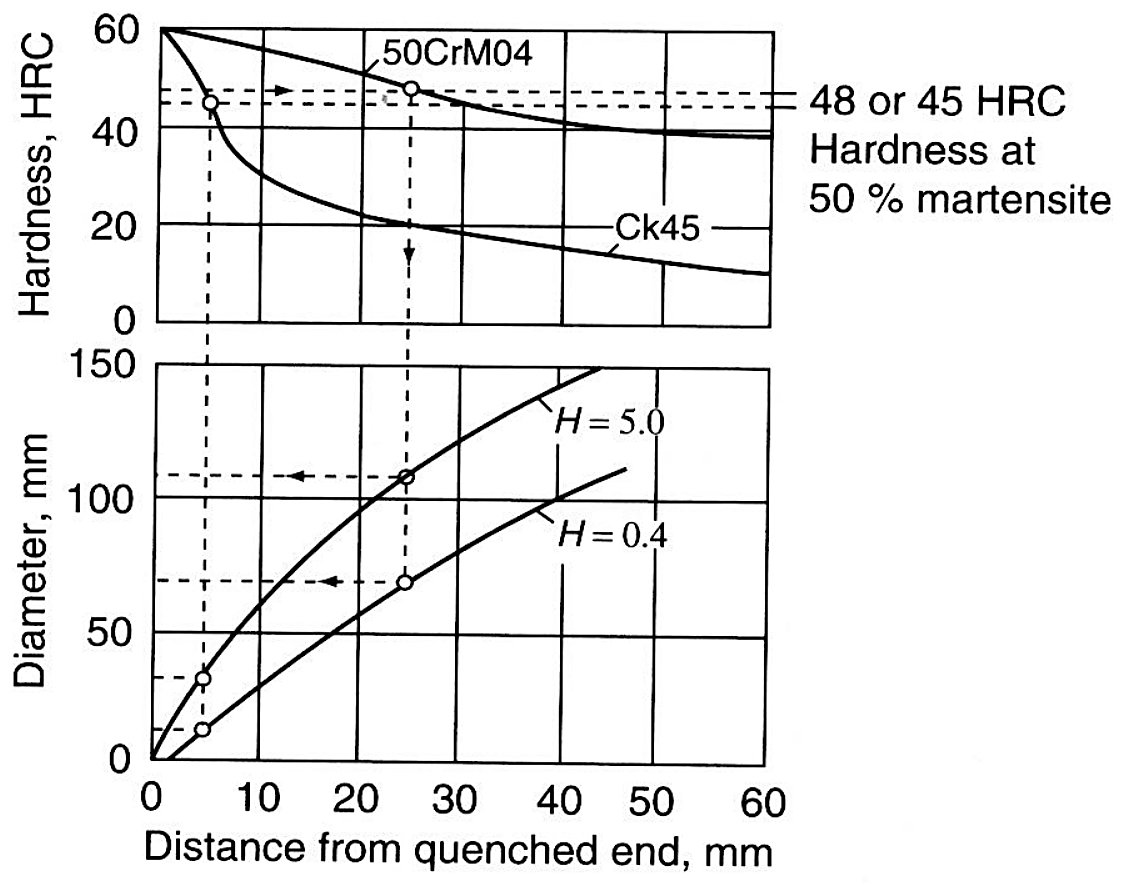
For everything that is not shallow hardening, the bar diameter that hardens through in a given medium is read off a diagram like this one.
Prehardened is a different purchase
P20 and the prehardened mold grades arrive at working hardness and are machined straight into the mold. The hardenability tables don’t apply unless the block is later hardened, which most mold shops avoid. Mold grades are grouped under plastic mold steels.
Keep the cycle with the steel
Hardenability sets what is possible; the furnace cycle decides what you get. The heat treatment guide lists the stages a tool steel cycle must include, and the mill certificate proves the analysis used to calculate hardenability.
Section size beats grade name
Two dies in the same grade behave differently when one weighs four times as much as the other. Where the section is the problem, the answer is usually a different grade rather than a longer soak time, and the grade selection guide works through that trade in the order a die shop faces it.
The same curve answers the section’s question: what is the largest bar that will still hold 50% martensite at the center in a given quenchant. The chart below reads that off for two grades at once.
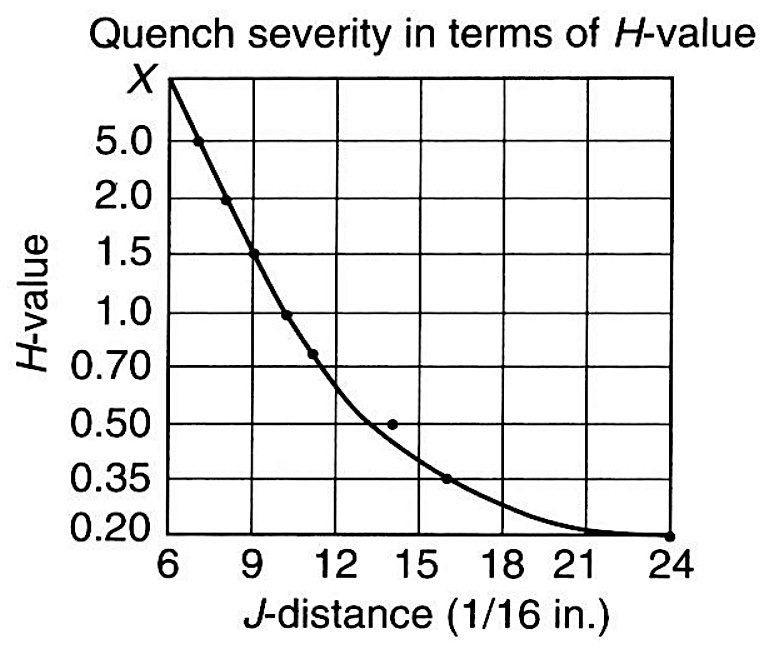
The two ways of describing the same quench, Jominy distance and H value, are tied together by one calibration curve.
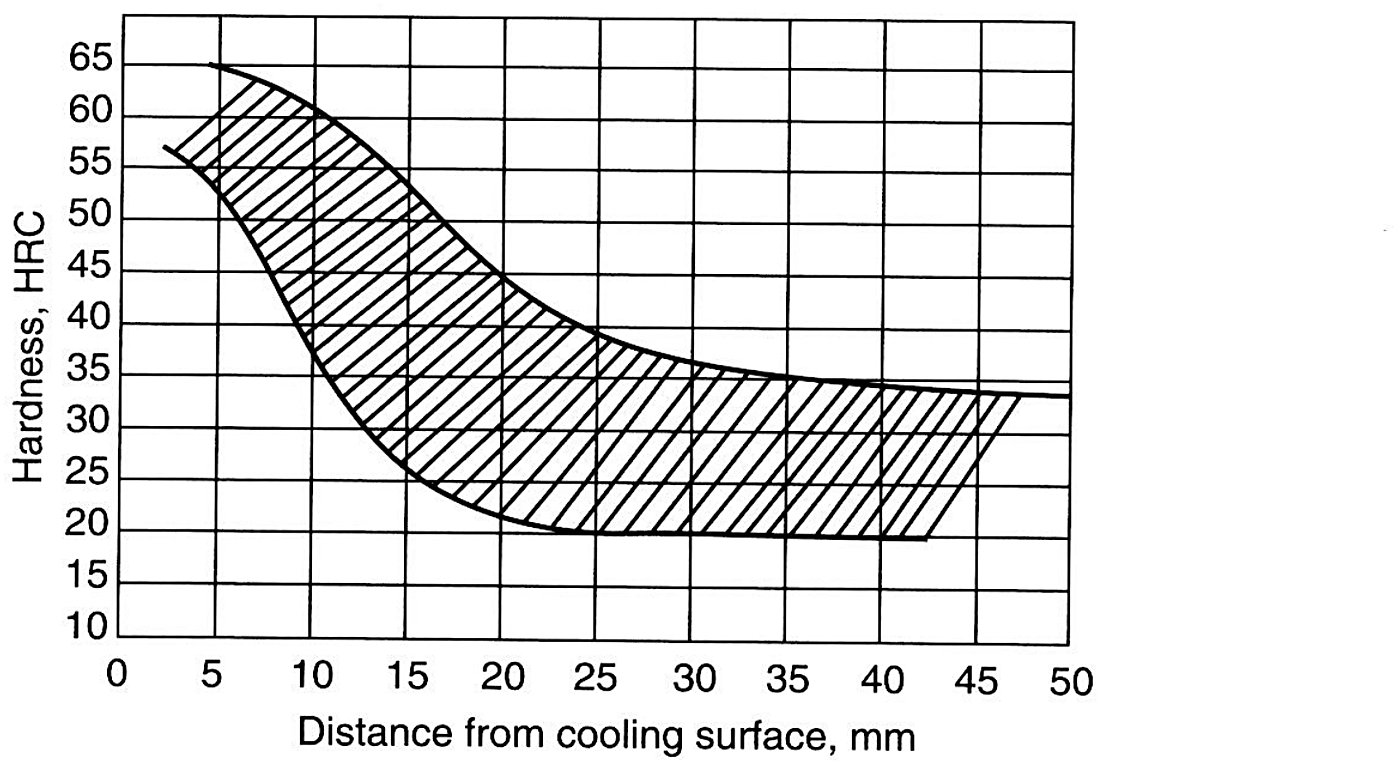
A hardenability band puts the whole argument on one chart. It gives the hardness range a grade can be expected to hold at a given distance from the quenched end, and the band width is the scatter the steelmaker is allowed for that grade.
Related reference pages
Tool steel heat treatment troubleshooting chart · Steel heat color chart · Tool steel tempering chart · Tool steel annealing and normalizing chart · D2 austenitizing temperature · Tool steel forging temperature guide · H steel composition chart
Sources: Tool and Die Making Troubleshooter (R. M. Leed, Hanser Gardner), Tables 5-6, 5-8, 5-10 and 5-11, themselves from Bethlehem Steel Corporation grade data sheets (1976 to 1981) and Bry Coat hardness conversion estimates. Reference data for comparison only. Confirm the quench and the depth on your own furnace with a test piece before production. Aobo Steel supplies tool steel in the annealed condition, and the customer performs hardening.