
Microalloyed Steel Strengthening Mechanisms
Microalloying means adding a few hundredths of a percent of niobium, titanium or vanadium to a low carbon steel, and it is the reason an ordinary hot rolled strip can reach a yield strength of 500 MPa or more without any quenching treatment. The additions work by forming carbonitrides, and those particles raise the yield strength in two separate ways. They hold the austenite grain boundaries during hot rolling so that the ferrite grains finish smaller, and the particles left in the steel after the phase transformation stand as obstacles that moving dislocations have to bow around. This page sets out how those two effects are separated and measured on commercial hot strip microalloyed steels, using the structure and property relationship of Pickering and Gladman as the base line. The chemical compositions and the rolling schedules of the same steels are collected on the microalloyed strip steel compositions page.
The base strength of a low carbon steel
Any discussion of precipitation strengthening starts from a base line, the yield strength a steel of the same chemistry would have with no carbonitrides in it at all. The relationship published by Pickering and Gladman gives that number from chemical composition and ferrite grain size alone, and it has been used for microalloyed hot strip since the 1970s.
σy (MPa) = 15.4 [ 3.5 + 2.1 (%Mn) + 5.4 (%Si) + 23 (%Nf) + 1.13 d-1/2 ]
The terms (%Mn), (%Si) and (%Nf) are the weight percentages of manganese, silicon and free nitrogen in solution in the ferrite, and d is the ferrite grain size in millimetres. The amount of free nitrogen is the hard term to pin down, because most of the nitrogen in a microalloyed steel has already been taken up by the carbonitride particles, and for the niobium steel below it worked out at 0.0025 wt%. Subtracting the calculated base value from the yield strength measured in a tensile test leaves the part of the strength that has to be explained by other mechanisms, which is the number the rest of this page is about.
| Treatment of the Nb steel | Ferrite grain size (µm) | Yield strength calculated (MPa) | Yield strength measured (MPa) | Additional strengthening (MPa) |
|---|---|---|---|---|
| Coiled | 10.0 | 252 | 310 | 58 |
| Normalized | 10.0 | 252 | 312 | 60 |
Source, Table 1 of the source chapter. Comparison between yield strength predictions from the equation above and the results of tensile testing on the niobium microalloyed steel. Normalizing was carried out at 900 °C for 30 minutes.
The niobium steel holds its strength through the normalizing treatment almost exactly, at 310 MPa before and 312 MPa after. That behaviour is itself the finding. Very fine carbonitrides that precipitate in the ferrite during coiling would grow and lose coherence during a 30 minute soak at 900 °C, and the yield strength would drop with them. It does not, so there was no such precipitation in the ferrite of this steel, and the extra strength has to come from particles that formed earlier, in the austenite, where the soak leaves them largely as they were.
The two equations that explain the extra strength
Carbonitride particles raise the yield strength by forcing dislocations to bow between them, and the Orowan and Ashby model expresses that as a function of how much of the steel the particles occupy and how large they are.
Δσ = [ 10.8 f1/2 / D ] ln (1630 D)
Here Δσ is the precipitation strengthening increment in MPa, f is the precipitate volume fraction and D is the mean particle diameter in micrometres. The volume fraction term is weak, in that the strengthening rises only with the square root of f, while the diameter term is strong, so coarsening the particles is the faster way to lose strength. Applied to the austenite precipitation in the niobium steel above, the equation returns about 65 MPa, which agrees with the 58 to 60 MPa that the tensile tests left unexplained.
Dislocations introduced by the phase transformation contribute through the second equation, which the early literature attributes to Keh.
Δσ = mαμbρ1/2
The term m is the Taylor factor for a polycrystal, α is a geometrical factor that depends on the type of dislocation interaction, μ is the shear modulus, which is 82,300 MPa for ferrite, b is the Burgers vector of the dislocation, 0.25 nm in ferrite, and ρ is the measured dislocation density. A value of mα of 0.4 is used as an intermediate figure. For the niobium steel the measured dislocation density was about 108 cm-2, which returns roughly 8 MPa, small enough to be called negligible beside the 58 MPa of precipitation strengthening. Interphase precipitation was found in this steel in only two of the twenty grains examined and on a coarse scale, so its contribution to the overall strength was negligible as well.
Carbonitride precipitation that forms in austenite
The particles responsible for the strength of these steels are not those that form after the transformation. They nucleate in the austenite while it is still being deformed, and they end up decorating the boundaries of the deformation substructure. Electron diffraction on the niobium steel confirmed that the carbonitrides had formed in austenite and not in ferrite.
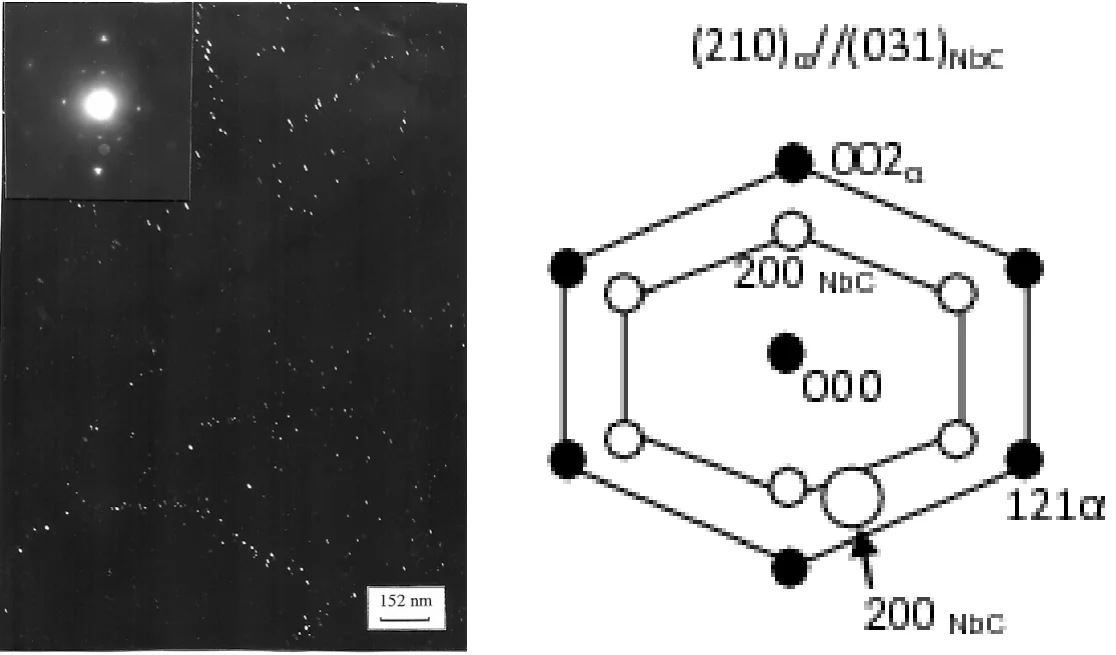
The distribution is not uniform. The particles sit in sheets and along boundaries rather than spread evenly through the grain, because that is where the austenite substructure gave them a place to nucleate. A particle distribution of that kind is what makes the average particle diameter, and not just the volume fraction, the number that has to be measured to predict the strength.
The NbTi microalloyed hot strip steel
A second commercial hot strip steel, microalloyed with both niobium and titanium, was studied in the same way and reached a much higher yield strength. Its chemistry and its rolling schedule are given below. Both tables are from the same investigation as the yield strength figures that follow.
The steel contains 0.12 wt% carbon and 1.21 wt% manganese, at the upper end of the range normally rolled on a hot strip mill, with 0.057 wt% niobium and 0.059 wt% titanium as the microalloying additions.
| Steel | C | Mn | Si | P | S | Al | Nb | Ti | N |
|---|---|---|---|---|---|---|---|---|---|
| NbTi | 0.12 | 1.21 | 0.33 | 0.023 | 0.008 | 0.048 | 0.057 | 0.059 | 0.008 |
Source, Table 2 of the source chapter. Chemical composition of the hot strip NbTi steel in weight percent.
The rolling schedule matters as much as the chemistry. The slab was soaked at 1150 °C so that the niobium and titanium carbonitrides were taken back into solution, finish rolling began at 1079 °C and ended at 870 °C, which is the part of the schedule that refines the austenite by repeated recrystallization, and the strip was then cooled at 10 °C per second and coiled at 650 °C.
| Steel | Soaking temperature (°C) | Finish rolling start (°C) | Finish rolling end (°C) | Cooling rate (°C/s) | Coiling temperature (°C) | Final thickness (mm) |
|---|---|---|---|---|---|---|
| NbTi | 1150 | 1079 | 870 | 10 | 650 | 7 |
Source, Table 3 of the source chapter. Processing parameters of the industrial hot strip rolling schedule. The source prints the finish rolling temperatures as start and end values for the same pass sequence.
The yield strength of the NbTi steel was measured as the average of five tensile tests in each condition. Subtracting the base value calculated from the composition and the ferrite grain size leaves an additional strengthening of 177 MPa in the as coiled strip, which falls to 69 MPa after normalizing. The fall is the signature of a real precipitation contribution. Where the niobium steel lost nothing during normalizing, the NbTi steel lost 108 MPa of the extra strength, and the level it fell to, 69 MPa, is close to the 58 to 60 MPa that the niobium steel holds in both conditions. The particles that survive a 900 °C soak are the ones that formed in austenite, and they account for the strength that remains.
| Treatment of the NbTi steel | Ferrite grain size (µm) | Yield strength calculated (MPa) | Yield strength measured (MPa) | Additional strengthening (MPa) |
|---|---|---|---|---|
| Coiled | 5.0 | 367 | 534 | 177 |
| Normalized | 5.5 | 357 | 426 | 69 |
Source, Table 4 of the source chapter. Comparison between yield strength predictions from the composition and grain size equation and the results of tensile testing on the NbTi steel.
Interphase precipitation in row formation
The NbTi steel carries a second mode of precipitation that the niobium steel does not. As the austenite transforms to ferrite, the interface between the two phases moves through the austenite and the carbonitrides nucleate on that moving interface, which lays them down in sheets whose spacing follows the growth of the ferrite. The result is a microstructure of parallel rows of fine particles, and it is much finer than the precipitation on the austenite substructure.
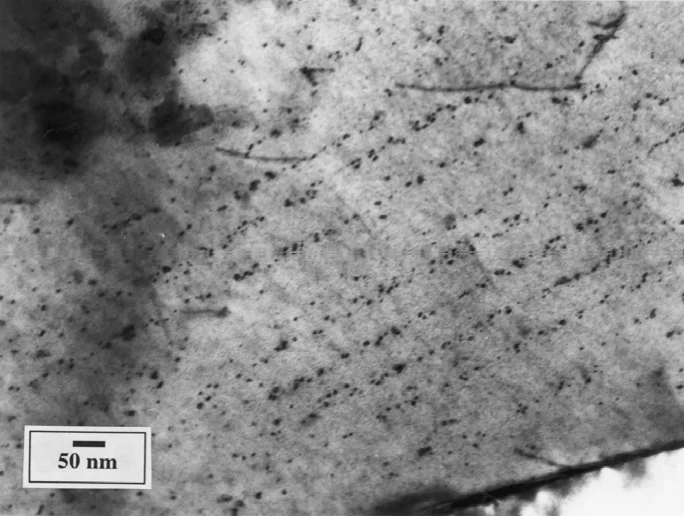
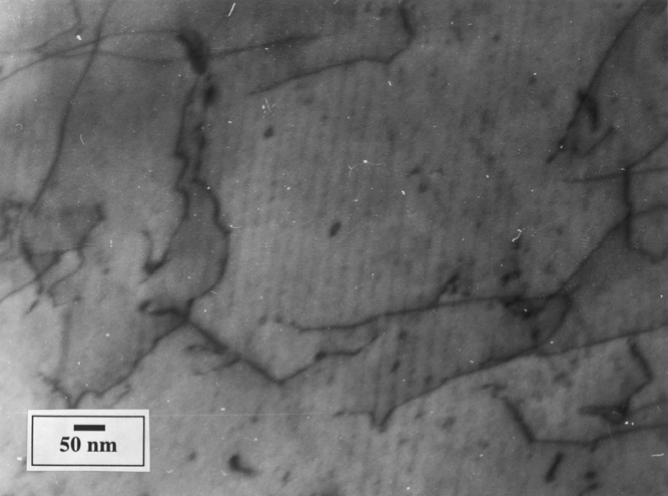
The two micrographs are the same phenomenon at two different scales, and the difference between them is the practical point. In the NbTi steel the rows are closely enough spaced that the particles between them offer a real obstacle to dislocation movement, so the mechanism contributes to the strength of the grains where it occurs. Its volume fractions were measured at 3.5 x 10⁻⁴ in the NbTi-2 steel, 4.9 x 10⁻⁴ in the niobium steel and 7.8 x 10⁻⁴ in the NbTi-3 steel, all in the same order of magnitude as the austenite precipitation and all small enough that the measurement has to be done on the electron microscope rather than inferred from chemistry.
Interphase precipitation does not occur in every ferrite grain. It is found in only a fraction of them, which is why its contribution to the yield strength of the whole piece has to be reduced by a rule of mixture. That heterogeneity is the reason the mechanism is easy to overstate in a simple calculation of the volume fraction, and the reason the microhardness of individual grains is the measurement that resolves it.
Separating the contributions in steel NbTi-3
The most detailed account in the source chapter follows a third steel, NbTi-3, through both conditions and separates every contribution to its extra strength. The measurements are given below, in the units the sources report them, with the particle diameter in nanometres and the volume fraction in units of 10-4.
| Sample condition | Particle origin | D (nm) | f, x 10-4 | Δσ (MPa) | ρ (cm-2) | Δσ (MPa) |
|---|---|---|---|---|---|---|
| Precipitation strengthening from the Orowan and Ashby equation, and dislocation hardening from the Keh equation | ||||||
| As rolled after coiling | Austenite | 7.2 | 6.2 | 92 | 5.2 x 10⁹ | 64 |
| Interphase | 4.0 | 5.0 | 112 | |||
| Total | 5.2 | 11.2 | 145 | |||
| After normalising | Austenite | 12.0 | 6.9 | 70 | 108 | <10 |
| Total | 11.0 | 13.0 | 102 | |||
Source, Table 9 of the source chapter. Substructural strengthening contributions in steel NbTi-3. A blank cell is a cell the source leaves empty, meaning the entry does not apply to that row.
Read the table by column. In the as coiled condition the austenite particles, 7.2 nm across and occupying 6.2 x 10⁻⁴ of the steel, are worth 92 MPa, the interphase particles at 4.0 nm and 5.0 x 10⁻⁴ are worth 112 MPa, and the dislocation density of 5.2 x 109 cm-2 is worth 64 MPa. The total of the precipitation terms is not the sum of the two, 204 MPa. It is 145 MPa, because a dislocation moving through ferrite does not know whether the particle in front of it formed in the austenite or on the interphase boundary, so the two populations of particles cannot both be counted in full. The source scales the local contributions by the ratio 145 to 204, which brings the interphase mode down to about 79.5 MPa and the austenite mode to about 65.5 MPa in the grains where both are present.
Taking that together with the finding that interphase precipitation occurs in only about half the ferrite grains of NbTi-3, and applying a simple rule of mixture, gives a total substructural contribution of 0.5 (92 + 64) + 0.5 (145 + 64) = 182.5 MPa. That number can be checked against the tensile test, because this steel appears in the same series as the two earlier ones.
| Processing conditions | Steel | Ferrite grain size (µm) | Yield strength calculated (MPa) | Yield strength measured (MPa) | Additional strengthening (MPa) |
|---|---|---|---|---|---|
| As coiled | |||||
| Nb | 10.0 | 252 | 310 | 58 | |
| NbTi-2 | 5.0 | 367 | 534 | 167 | |
| NbTi-3 | 4.2 | 393 | 603 | 210 | |
| Normalised | |||||
| Nb | 10.0 | 252 | 312 | 60 | |
| NbTi-2 | 5.5 | 357 | 426 | 69 | |
| NbTi-3 | 4.5 | 386 | 462 | 76 | |
Source, Table 8 of the source chapter. Yield strength and additional strengthening contributions from the composition and grain size equation, in the as coiled and after normalising conditions.
The tensile test leaves 210 MPa unexplained in NbTi-3 as coiled, and the rule of mixture above accounts for 182.5 MPa of it. The two numbers are close enough that the source calls the agreement reasonable. Drop the interphase precipitation from the calculation, on the assumption that it never happens, and the substructural contribution falls to 92 + 64 = 156 MPa. The difference between 182.5 and 156, about 26.5 MPa, is therefore the whole value that the interphase mode adds to the strength of the steel as a bulk property, even though locally, in the grains where it is present, it is worth far more.
Microhardness of the individual ferrite grains
A bulk tensile test returns one number for a steel whose ferrite grains are not all the same, so it cannot show a mechanism that operates in half of them. Vickers microhardness on individual grains can, and the source chapter uses it to count the grains in each population.
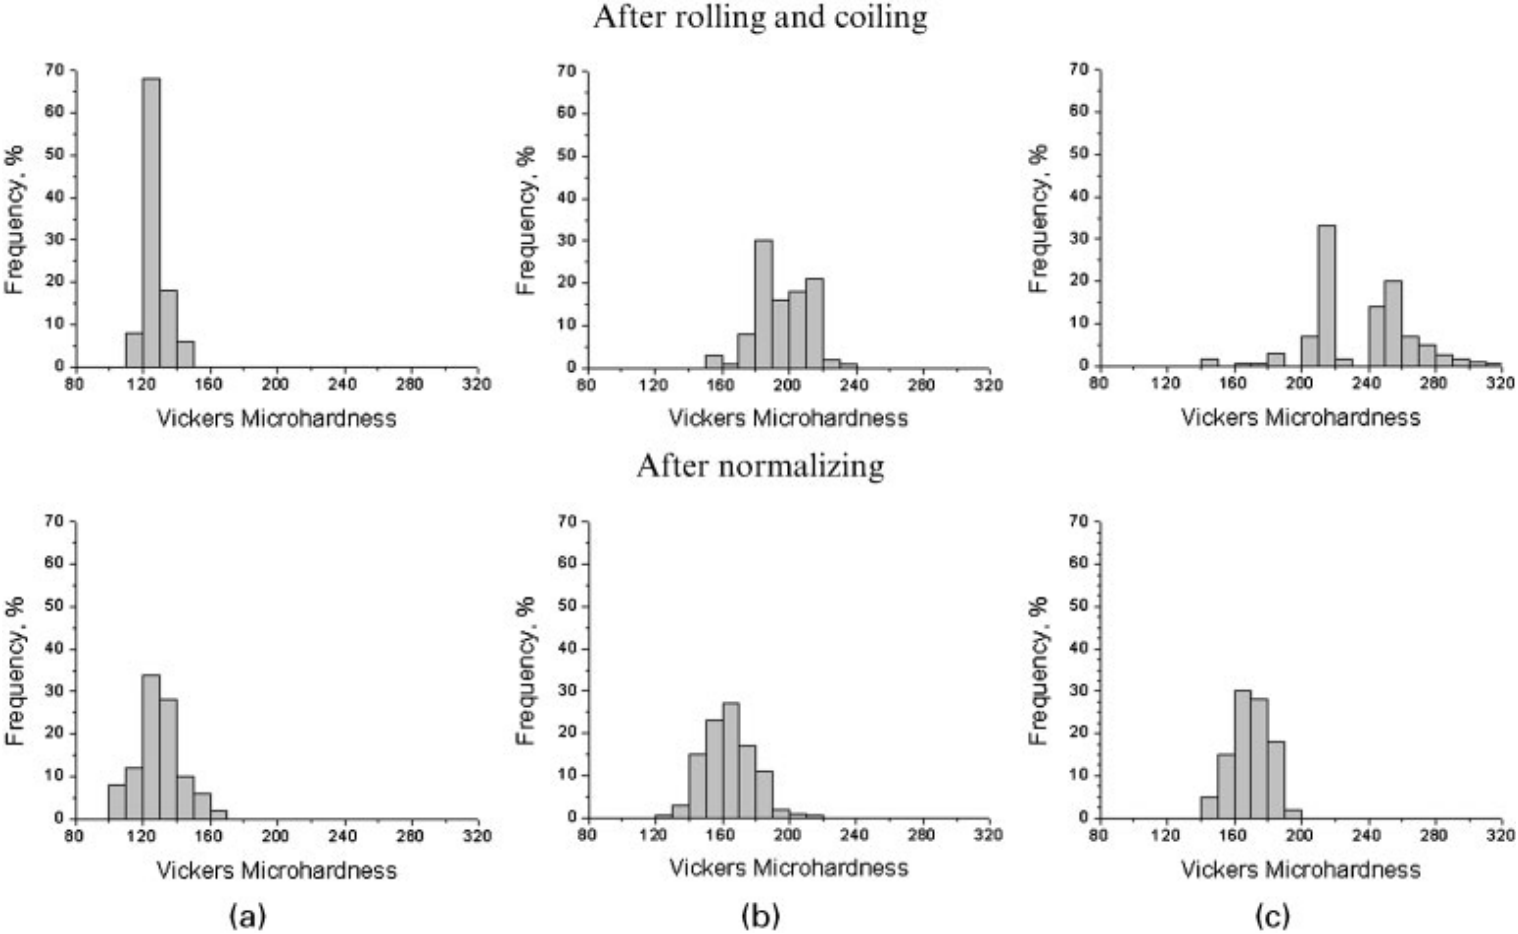
Two separate hardness peaks appear in both NbTi steels in the as coiled condition, and the separation is widest in NbTi-3, at about 40 HV. The second, harder peak is the population of ferrite grains carrying interphase precipitation. Normalizing removes that peak in both NbTi steels, which is the same loss of strength that the tensile tests recorded, and it also lowers the first peak, which is the loss of the transformation dislocations. The niobium steel, in the bottom left panel, has one peak in both conditions and its position does not move, matching the finding that it holds 310 to 312 MPa either way.
The proportion of grains under the second peak gives the fraction to use in the rule of mixture. In NbTi-3 that is 53% of the grains, and the additional strengthening measured on them averages 99 MPa. The same grains were put at about 79.5 MPa by the electron microscope observations, so the two independent measurements of the local contribution agree to within about 20%.
What the analysis means when buying strip
Three things follow for a buyer or a specifier of microalloyed hot strip. The yield strength of a microalloyed steel is not explained by its chemistry alone, so a mill certificate that lists Nb and Ti says nothing about the strength the strip will actually have. What delivers the strength is the combination of chemistry with a controlled rolling schedule, and the same chemistry rolled without the low finish rolling temperature and the fast cooling will come out at the base value. Where the extra strength is produced by precipitation, it is partly recoverable and partly not. Heating the strip to 900 °C for half an hour returns an over aged condition, and the interphase contribution in the NbTi steels largely disappears while the austenite precipitation survives. That difference matters whenever a strip part is to be normalized after forming, because the strength that survives the treatment is the 60 to 76 MPa that Table 8 records, not the 167 to 210 MPa that the strip was sold with.
The measured yield strengths in this chapter run from 310 MPa for the plain niobium steel to 603 MPa for NbTi-3 in the as coiled condition, on steels that all contain less than 0.15 wt% carbon and no more than 1.54 wt% manganese. A niobium addition therefore replaces a significant part of the alloy content that a quenched and tempered grade would need, which is the reason the microalloyed family is specified where a part can be made from strip rather than from bar or plate. Where the part has to be made from bar or plate and has to hold its hardness while it runs hot, a quenched and tempered tool steel is the correct answer, and the hardness a given grade reaches at a given section is set out on the tool steel hardenability and section size page.
Source: Alloy Steel, Properties and Use, InTech, 2011.